








A guide to growth metrics for startups that don't fit in

Contents
Most advice about growth metrics and revenue ops is for businesses that follow classic B2B SaaS – predictable contracts, a single product, and clean MRR lines.
PostHog, on the other hand, is pretty weird. 90% of our users are indie developers who stay on the free tier for life. We do usage-based pricing and literally tell people to pay us less. We also serve free hot dogs at developer conferences.
We've more than 6x'd our ARR over the two years since I joined. That number itself says a lot, but I also want to talk about the work that went into figuring that number out.
Here's the advice about growth metrics I'd give to founders at companies that don't follow the standard playbook.
1. Defining your ICP is not optional
If you pull PostHog's retention data without any filters, you'll see a curve that drops hard in the first few months. Investors often flag this as a concern – for most companies, it is one.
But for us, it's not. Hobbyists try PostHog for short-term projects and then bounce – they were never going to stick around. When you filter for our actual ICP – the people building products at high-growth startups – retention is actually healthy:
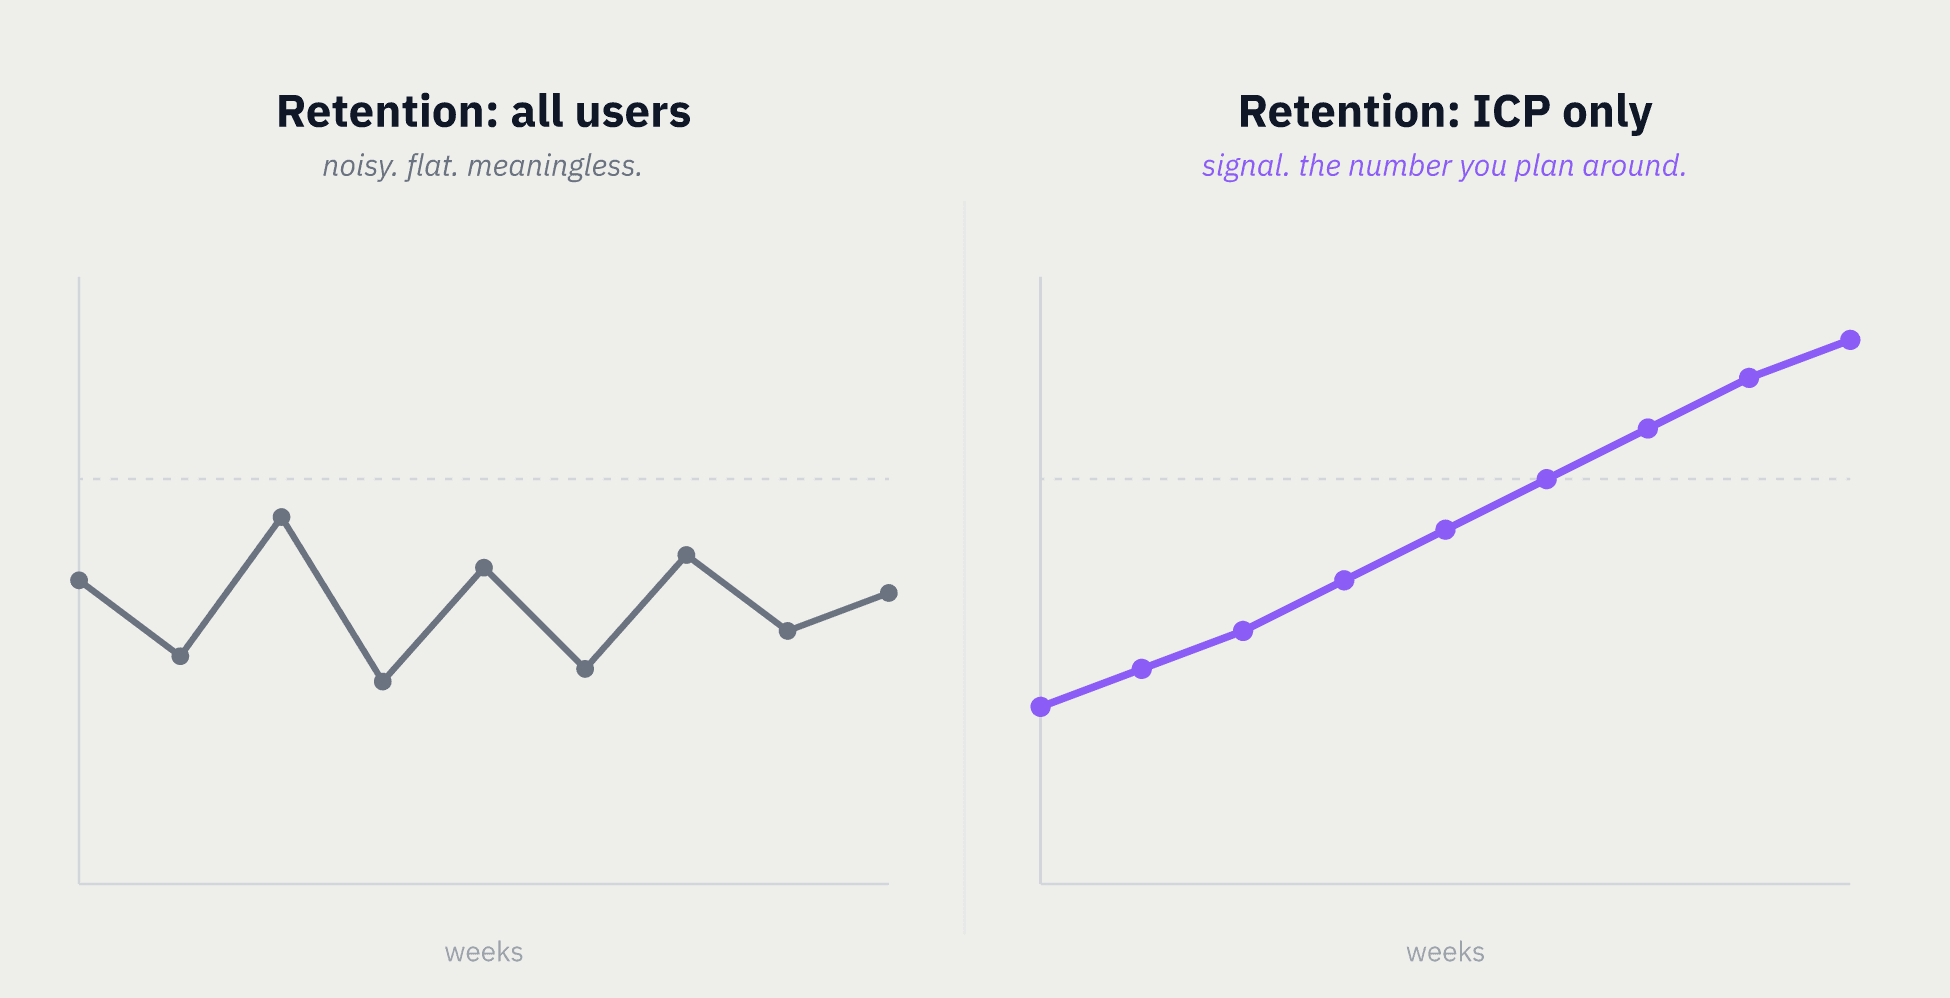
That's the power of a strong ICP definition. A lot of founders think of ICP as this fuzzy sales and marketing framework, but it's the foundation of your entire business. It ties your product to the market and cascades to every function. You can't skip it.
If you don't define your ICP, you'll suffer. And I get why people struggle with it – it requires making a bet on who you're not building for, which feels scary when you're hungry for revenue and worried about ruling anyone out. It's also tempting to keep your ICP broad so you have wiggle room, but a vague ICP is just no ICP. You need to get specific enough that it feels a little uncomfortable.
Defining our ICP is the most important thing we've ever done. The rest of this article is pointless if you don't start with this.
We already wrote a lot about how to do this, so I'll link them here instead of repeating them:
- How we found our Ideal Customer Profile – our co-CEO James on the exact process we ran, including tracking customers who didn't buy
- The Product-Market Fit Game – how ICP and PMF are intertwined, and why you can't find one without the other
- How to measure product-market fit – once you have an ICP, how to tell if you actually have fit within it
2. Make customer traits queryable across all functions
Too many founders just define their ICP and then stop. This is a mistake.
Saying "these are the customers we want" is the easy part. Making sure your whole team can actually go after them is the work. A product manager looking at feature adoption rates needs to be able to filter product telemetry by ICP and non-ICP customers, or else they'll continue to be misled by noisy data. All functions – product, sales, engineering, marketing, everyone – need to be able to query by the same customer traits across all data. That's how you make sure everyone's actually working toward the same goal.
Operationalizing this is where I spent most of my first year at PostHog.
I started by building a Clay automation that checks multiple data sources for every new signup – company size, industry, funding stage, tech stack – and pushes that data back to PostHog as person properties. It runs automatically, so anyone on the team can slice any insight by ICP match in seconds without having to re-derive who counts.
One challenge I faced was that most enrichment vendors are built around large enterprise customers. If your ICP is startups or early-stage companies, you'll find a lot of gaps. Clearbit is great for big company data, but it wasn't working for the kinds of companies we care about. We eventually found Harmonic, which indexes startup data for VCs, and it had much better coverage for our segment.
We've since extended the same enrichment data to combine with usage signals that sales looks at (e.g., activation events, invite volume, feature breadth) to score accounts for expansion potential. Strong matches get tagged in Salesforce for outreach, which is how we're expanding our product-led growth motion into product-led sales.
3. Iterate openly
Once we had systems to query for ICP data, my next step was to actually start measuring our growth in this segment.
The first version of any metric you build isn't wrong but it may not tell you much about how your business is actually doing. The point isn't to nail it on day one. It's to start with a simple version that everyone in your company understands, then iterate. If your methods are confusing, no one will use the metric. We learned this the hard way. Early on, we built a bunch of dashboards broken down every which way. Only a couple ended up being useful. The rest were either ignored, or someone would look at them occasionally and find them stale or confusing.
In practice this iteration looked noisy with ups and downs in our retention numbers every month, someone asking why it moved, me explaining the gap, identifying the pattern, modeling a cleaner version, sharing it back with team, and repeating. This part can feel frustrating because I'd always have to add caveats along the lines of "here's the number, but here's how it would change if we reported it differently." It feels like you're publishing imperfect work over and over. You are. That's the loop.
Here's the kind of pattern only the loop could have surfaced for us: when a customer implemented PostHog incorrectly, they'd sometimes generate a spike in billed events and then churn. That showed up as a great revenue expansion followed by unexpected loss. This looked like a business problem on paper, but it was really an onboarding one. We only caught it because someone kept asking "why did this number move?" and we kept digging.
Each cycle gets you closer to a number you can trust. Every "wait why did this move?" is a noise source surfacing, and once you can name it you can do something about it.
4. Name your noise sources
Patterns start to repeat after a few cycles. The job stops being "figure out what's weird about this month's number" and becomes "encode what we already know is weird." That sounds dry, but it changes the whole experience of reporting. Initially every monthly number came with a fresh footnote. Today our retention calculation has a documented list of standing corrections for things we know systematically distort the picture if we don't account for them.
Each of these used to be a footnote I'd rewrite every month. Now they're standing adjustments, documented in one place. Anyone on the team can pull up the calc and see what's being corrected for and why.
The framing shift that helped me: noise isn't something to apologize for. It's a property of your business. Some sources you fix at the data layer, others you accept and account for. Your goal is to identify them and stop being surprised.
5. Be opinionated but defensible with your numbers
For our retention metric, we now use average quarterly MRR, annualized:
Taking the average of three months before annualizing means that a short month — February has three fewer days than March, which creates a mechanical dip in usage-based revenue — no longer distorts the picture. It also smooths out one off spikes from a single big launch or an unusual billing cycle, so the number moves with the actual trend of the business rather than with noise.
We can report it with confidence now. It's segmented for the customers we actually care about, and calibrated to how our business work. This isn't a template metric. We landed on it because we understand our own business in detail: what counts as noise, what counts as signal, and what investors will push back on.
What you measure depends a lot on your stage too. If you're pre-revenue, anchor on whatever value you're actually delivering and find the metric closest to it. If you're a classic SaaS it's how often each user actually gets something useful from the product (not just whether they logged in). For an AI company, frequency might not be the right frame at all, it's more about how you define value for those customers.
Once you have revenue, pair it with retention. That combination forces the right question: are the users I'm retaining actually generating revenue? If your growth is 12% but retention is 75%, you're not really compounding. You're just refilling a leaky bucket.
The specific formula matters less than the principle: be opinionated about what accurately represents your business, be ready to explain it, and stick with it. The goal is a number that tells the story with as few footnotes attached as possible.
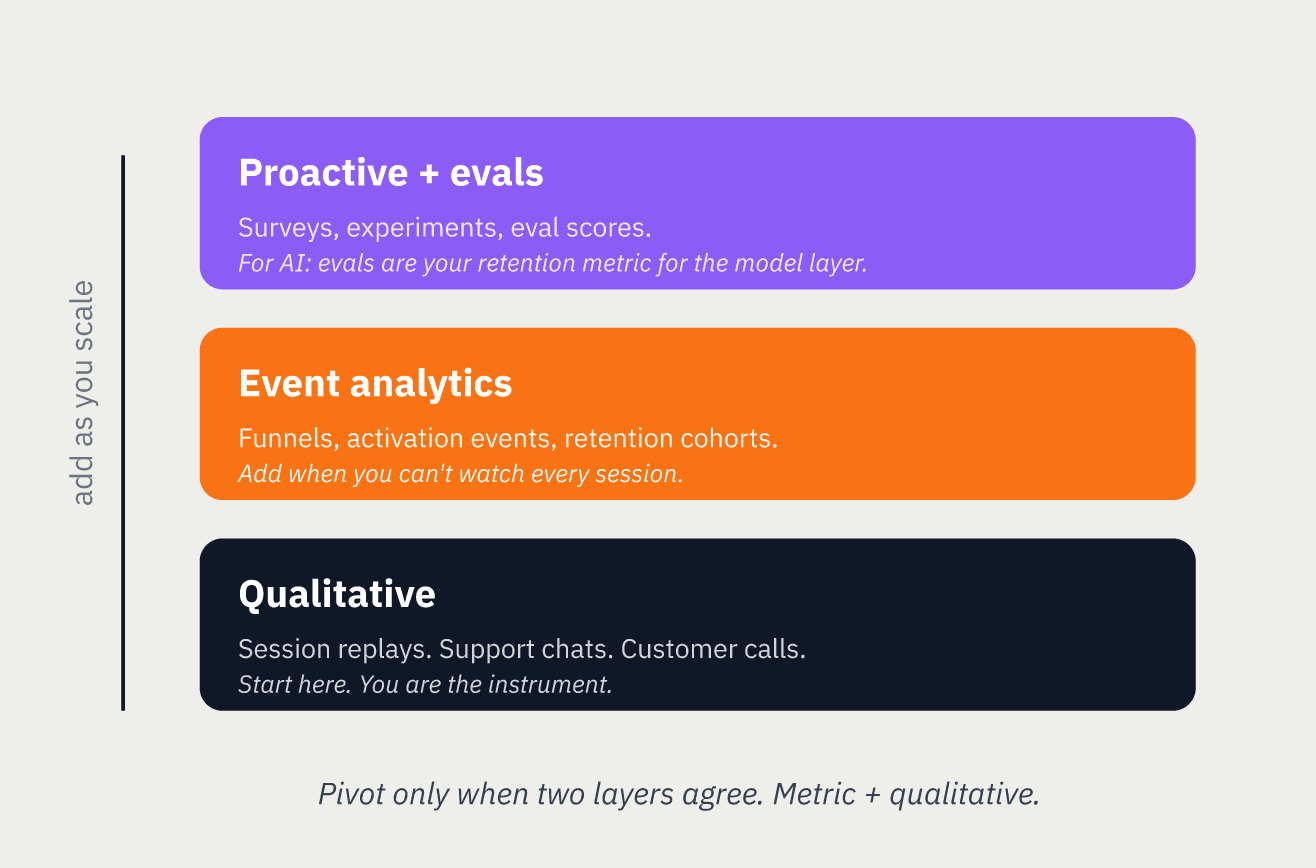
The biggest pitfall I see from founders is complicating things too early to a point where they can't concretely answer why they chose to measure something the way they did. To counter that, I always suggest starting simple and layering on more only once you have the previous layers in a good state:
PostHog is an all-in-one developer platform for building successful products. We provide product analytics, web analytics, session replay, error tracking, feature flags, experiments, surveys, AI Observability, logs, workflows, endpoints, data warehouse, CDP, and an AI product assistant to help debug your code, ship features faster, and keep all your usage and customer data in one stack.